A Long Path Ahead
I think the title says it all. In fact, it has summed up the essence of everything in this blog so far. The market has a long way to go before it reaches the final bust process; I have a long way to go before I am close to the achievements of Jesse Livermore; This blog has a long way to go (I certainly hope so). In a bid to prepare for the long path ahead, sometimes you have to pause for a while and think. Cliche as it sounds, but when men try to speed things up in life, more often than not, men forget how to stop and think for a second.
When I look back at recent posts, I realise that I have lost my focus. All the facts, figures, fuzzy logic, economic theories and so on are pointless if they aren't strung together with a main focus. This is probably a very big reason why I'm so far away from the level of Jesse Livermore. lol
The idea of the post on the possible demise of USA is to introduce a mentality.
1. The market does not follow a upward trend forever. This is actually in line with an old midweek post on "mentalities in the market". Sadly, as much as I emphasize on this mentality, I myself was stuck with the mentality that the market will keep going down.
I have made the mistake of neglecting the long side of the market just like most people with the short side of the market.
Again I'm not an economics-oriented type of person. I firmly believe that there is only an indirect relationship between the stock market and the economy. In the long run, the stock market is supposed to reflect the economy though.
2. I'm trying to open up your investment/trading mentality to the concept of asset classes. I talk about a period of time where everyone will hate stocks just like what happen during the great depression time. Stocks shouldn't be the only area that you look at for investment. I talk about gold. I talk about shorting which implies put futures since they are trying to curb short selling nowadays. The idea is you have to be open to these options for a period of time where the stock market will not look pretty.
Short post as it seems but it carries a lot with it. If you do take a pause and think through what you read on my post or learn on your own so far, I believe you will understand how I feel and the purpose of this post.
Resting is to prepare for a longer journey ahead.
Wednesday, July 30, 2008
Sunday, July 27, 2008
Iching Before Ipod
Realising that part 1 on the demise of USA is rather dry, I have decided to make things more interesting by employing a new style of looking at things. This post is still relevant to the "possible demise of USA" post on a whole but is not based on real sound foundations to be considered part 2. I believe I am the only few people that use the Book Of Change a.k.a I-Ching, to look into economy cycles and translate that into stock market performances.
I have to convince you into believing in cycles because what I emphasize on Part 1 is based on the idea of cycles. Rise and fall of nation, forest fires, credit expansion leading to credit contradiction etc are all in the form of a cycle.
The Book Of Change
Olympics is near, but I am not trying to show off some of China's greatness, bear this in mind =). I-Ching is one of the five classics that ancient chinese must read before they go for their imperial exams. Even though it is more of a philosophy book, most people claim to use it for divination purposes. Ignore the divination part, I'm not superstitious either. But the idea of the book is about changes which eventually lead to a cycle for everything.
Basically it employs the binary expression of 1 and 0 to come out with the possibility of everything regarding the universe. There are 64 diagrams altogether but what I'm interested in and going to explain is the very first diagram known at the "Qian" (expression of 111111)
In I-Ching, most effort is spent on this diagram and the second diagram which is the exact opposite of "qian".
I will briefly describe the diagram starting from the first expression (the first 1).
1. Chinese likes to use dragon. The first expression describe a hidden dragon that has no use currently. I must clarify that I-Ching has nothing to do with the movie crouching tiger hidden dragon! Jokes aside, basically the dragon is waiting for an opportunity. Just that currently, it's preparing for the time for to time.
2. Moving on to the second expression - garnering the support of the masses and being beneficial to the masses which in turn benefits oneself. Benefits move two ways. One that gives to the community will eventually benefit and take from the community.
3. Peacefulness sums up the third expression but this is what we see on the surface. Actually a turning point is being talked about at this stage, where one chooses to achieve more or is simply pleased with current stage. Outcome depends on one's behaviour.
4. With some thoughts, you should know what's coming for the fourth expression. One chooses to achieve more and grabs the opportunity and jumps straight for the top. But to an extent, one is not leaving the community alone. There is another side of this where one chooses to be pleased with current stage but it is not very relevant.
5. At this stage or the fifth expression, the dragon is high up in the sky. It enjoys a greater support and respect from the masses. Most have recognised the dragon and embraced it. The masses here are greater than those in stage 2.
6. The last expression emphasizes on "regret". This regret is already entrenched at the fifth stage because one gets complacent after conquering the world. One no longer considers one's actions or prepares for crisis time. The dragon rises blindly and flies too high out of its comfort zone, causing it to regret. The dragon was once a rising dragon but had become a battling dragon at this stage. The result of this is because of the fifth stage actually.
Fuzzy Logic Time
I have to admit that applying I-Ching on the economy and stock market is unheard of and to an extent, crazy. But as crazy as it sounds, I feel that one should treat this with an open mind.
Personally I think the process from stage 1 to stage 5 is pretty straightforward. The important part of this "qian" diagram lies with the underlying problem at stage 5 and the ending stage which respresents a downfall. Well, "qian" diagram is supposed to be a very auspicious diagram if you manage to draw using divination methods. But notice that it ends on a sour note. It could end on the fifth stage but because of the elasticity (this is why it covers all possibility) of the I-Ching philosophy, it reminds people of the possible downfall of the dragon because seeds of crisis are planted unknowningly at stage five. Complacency is dangerous.
Let's look at the rise of USA.
If you refer back to K-wave theory last week, it actually shows that the winter period (stage 6) was from Great Depression to World War II. Winter is immediately followed by Spring so World War II is the turning point actually. Singapore does not have any seasons change, we have summer all year round and believe me, the weather is devastating. So I never reach experience the change from winter to spring. I will attempt to apply the various stages to the rise of USA.
1. Opting for an isolationism pokicy, USA did not want to participate into World War II. Since the Great depression, the recovery was rapid (hidden dragon).
2. Supported the allied countries and joined the United Nation after the war. Was also one of the two dominant superpowers afterwards.
3. It could have enjoyed some peace but it chose to fight for superpower by entering into the cold war. Meanwhile, the American people completed their great migration from the farms into the cities and experienced a period of sustained economic expansion.
4. Reagan took a hard line against the Soviet Union, teaming up with friend and ally Margaret Thatcher against the "Evil Empire". Communism finally collapsed in Russia in 1991.
5. After the fall of Soviet Union, the United States emerged as the world's sole remaining superpower. Well don't forget that the stock market was in a wonderful bull run that started in 1982 as United States fight for superpower. But as expected, seeds of crisis are planted along the way. Complacency sets in.
6. You have the crash of Nasdaq which was caused by speculation, a sign of recklessness and complacency isn't? Subprime housing crisis was also one of the consequences that result from the complacency of financial "geniuses". Trust me, this is not the end yet. Again, to link it back to last week post, the derivatives market could be the final meltdown of the world's financial system and the eventual downfall of the great U.S of America.
This odd fact that a reaction that makes sense arises out of a technique seemingly excluding all sense from the outset, is the great achievement of the I Ching
Carl Jung
I have to convince you into believing in cycles because what I emphasize on Part 1 is based on the idea of cycles. Rise and fall of nation, forest fires, credit expansion leading to credit contradiction etc are all in the form of a cycle.
The Book Of Change
Olympics is near, but I am not trying to show off some of China's greatness, bear this in mind =). I-Ching is one of the five classics that ancient chinese must read before they go for their imperial exams. Even though it is more of a philosophy book, most people claim to use it for divination purposes. Ignore the divination part, I'm not superstitious either. But the idea of the book is about changes which eventually lead to a cycle for everything.
Basically it employs the binary expression of 1 and 0 to come out with the possibility
 of everything regarding the universe. There are 64 diagrams altogether but what I'm interested in and going to explain is the very first diagram known at the "Qian" (expression of 111111)
In I-Ching, most effort is spent on this diagram and the second diagram which is the exact opposite of "qian".
I will briefly describe the diagram starting from the first expression (the first 1).
1. Chinese likes to use dragon. The first expression describe a hidden dragon that has no use currently. I must clarify that I-Ching has nothing to do with the movie crouching tiger hidden dragon! Jokes aside, basically the dragon is waiting for an opportunity. Just that currently, it's preparing for the time for to time.
2. Moving on to the second expression - garnering the support of the masses and being beneficial to the masses which in turn benefits oneself. Benefits move two ways. One that gives to the community will eventually benefit and take from the community.
3. Peacefulness sums up the third expression but this is what we see on the surface. Actually a turning point is being talked about at this stage, where one chooses to achieve more or is simply pleased with current stage. Outcome depends on one's behaviour.
4. With some thoughts, you should know what's coming for the fourth expression. One chooses to achieve more and grabs the opportunity and jumps straight for the top. But to an extent, one is not leaving the community alone. There is another side of this where one chooses to be pleased with current stage but it is not very relevant.
5. At this stage or the fifth expression, the dragon is high up in the sky. It enjoys a greater support and respect from the masses. Most have recognised the dragon and embraced it. The masses here are greater than those in stage 2.
6. The last expression emphasizes on "regret". This regret is already entrenched at the fifth stage because one gets complacent after conquering the world. One no longer considers one's actions or prepares for crisis time. The dragon rises blindly and flies too high out of its comfort zone, causing it to regret. The dragon was once a rising dragon but had become a battling dragon at this stage. The result of this is because of the fifth stage actually.
Fuzzy Logic Time
I have to admit that applying I-Ching on the economy and stock market is unheard of and to an extent, crazy. But as crazy as it sounds, I feel that one should treat this with an open mind.
Personally I think the process from stage 1 to stage 5 is pretty straightforward. The important part of this "qian" diagram lies with the underlying problem at stage 5 and the ending stage which respresents a downfall. Well, "qian" diagram is supposed to be a very auspicious diagram if you manage to draw using divination methods. But notice that it ends on a sour note. It could end on the fifth stage but because of the elasticity (this is why it covers all possibility) of the I-Ching philosophy, it reminds people of the possible downfall of the dragon because seeds of crisis are planted unknowningly at stage five. Complacency is dangerous.
Let's look at the rise of USA.
If you refer back to K-wave theory last week, it actually shows that the winter period (stage 6) was from Great Depression to World War II. Winter is immediately followed by Spring so World War II is the turning point actually. Singapore does not have any seasons change, we have summer all year round and believe me, the weather is devastating. So I never reach experience the change from winter to spring. I will attempt to apply the various stages to the rise of USA.
1. Opting for an isolationism pokicy, USA did not want to participate into World War II. Since the Great depression, the recovery was rapid (hidden dragon).
2. Supported the allied countries and joined the United Nation after the war. Was also one of the two dominant superpowers afterwards.
3. It could have enjoyed some peace but it chose to fight for superpower by entering into the cold war. Meanwhile, the American people completed their great migration from the farms into the cities and experienced a period of sustained economic expansion.
4. Reagan took a hard line against the Soviet Union, teaming up with friend and ally Margaret Thatcher against the "Evil Empire". Communism finally collapsed in Russia in 1991.
5. After the fall of Soviet Union, the United States emerged as the world's sole remaining superpower. Well don't forget that the stock market was in a wonderful bull run that started in 1982 as United States fight for superpower. But as expected, seeds of crisis are planted along the way. Complacency sets in.
6. You have the crash of Nasdaq which was caused by speculation, a sign of recklessness and complacency isn't? Subprime housing crisis was also one of the consequences that result from the complacency of financial "geniuses". Trust me, this is not the end yet. Again, to link it back to last week post, the derivatives market could be the final meltdown of the world's financial system and the eventual downfall of the great U.S of America.
This odd fact that a reaction that makes sense arises out of a technique seemingly excluding all sense from the outset, is the great achievement of the I Ching
Carl Jung
Wednesday, July 23, 2008
Mid Week Pit Stop #14
Mistakes
Stock market is a place where you can't stop learning. In order to better your performances, you have to review your mistakes and not repeat them in the future. You can win the game once but you can't beat the game forever, remember this.
Let's look at how I have been performing so far and my mistakes.
The first mistake was holding on my shorts for too long. This is actually a mentality issue. I will briefly talk about the whole sequence. Firstly I was very negative. Well it paid off for being negative in fact. Oil killed the airlines and autos like AMR and GM. To some extent, the oil effect spilled over to the financials and kills the financials as well. At that point of time, a common sense play was to go short and I did. AMR was down below $5; GM below $10; Lehman, an example from the financials, was around $12. My whole portofolio was up for 90%, most stocks were down 50% or more in a month. Pretty good isnt it?
The problem came when I actually doubled my shorts (tripled/quadrupled on some, especially lehman). They were already beaten down so badly and at price down 60% from my first short, I went to short even more. Plain stupidity! The only way that my shorts would pay off, was a possible bankruptcy scenario. I admit that this scenario was playing out in my mind at that point of time but timing was wrong.
I did cover some of my shorts though. Fannie, Freddie, AMR and GM were the stocks that I covered actually. Somehow their prices are too low for me to keep holding them. That's just an instinctive play. Not really something to be proud of. All the financials were not covered. I don't have the portfolio statistics for that point of time anymore but Lehman was down 60% from my first short. You could infer the prices of other financials, it's not tough. The negativity helps me at first but also kills me in the end because I become too negative and ignore the timing.
Timing sums up my second mistake. I'm refering to two types of timing over here; timing of more shorts and timing of the plunge. The mistake for timing of more shorts was obvious. Shorting when the stocks are down, is fine. But shorting when the stocks are down badly, is not. If I have been more systematical with my shorts and spread them out at the price level like intervals of 10%, I will probably be much better than now. I'm having a negative portoflio now. Actually, I'm not very frustrated with this mistake, to some extent, shorting those stocks at such low prices was to prove a point that stocks that make new low can go lower. Obviously, they are already very low.
The mistake of the timing of the plunge was something that I'm frustrated with myself. If you remember, my plan at start was shorting into a stock market plunge that would be ignited by a catalyst and Fed meeting was set as the catalyst, either the July meeting or the 5th Aug meeting. Nothing was made out of the July as expected. But fear of high oil price crept into the market as oil continued its trememdous climb. Markets were down badly for many days and mortgages, an unexpected catalyst, began to capture the attention again.
This time it was Fannie mae and Freddie mac. Fortunately (the F word just can't seem to go away isn't it? LOL), I had a short position on Fannie mae. Things worked out well as I covered Fannie and Freddie (added it when it was up 20% few days back, suddenly I have become smart!) on friday as I believe there will be some news to save them by the Fed. Everything was spot on as I shorted Fannie and Freddie again on monday as they opened up higher again. Along the way, some financials were added. One day, it comes to a point where I think the Fannie and Freddie story is over, I infer from the prices and cover those stocks with AMR and GM as well. The unexpected problem begins to end.
The market plunge was premature for me to some extent. One, I think the trigger should be the Fed's meeting. Two, the cycle is completed. If I had drawn an analogy to Bear Sterns in March, I should be expecting a rally isnt it? Sadly, I didn't. Financials rallied strongly and I was beaten by myself and the market. I failed to refer back to my plans and draw previous experiences. Urgency was lacking in me. Even though a market downfall was expected but it was happening too early based on my own plans and I didn't adjust to it.
Comical way of looking at my performance
Actually when I come to think of it, the reason why I'm holding a negative porfolio is because of credit expansion. I shorted a lot of stocks, the gains gave me more money and more margins to play with. Shorted even more out of my comfort zone and the cycle repeated many times. The price of the market got so low and it was clear that it had to go up. I got caught as the prices came going up. Soon I filed for bankruptcy (alright, this is not true but I can't find a better ending to end the story).
If you replace shorting with buying, low with high, up with down, you get the idea of credit expansion and what we are facing now.
The current crisis is not only the bust that follows the housing boom, it's basically the end of a 60-year period of continuing credit expansion based on the dollar as the reserve currency
George Soros
Sunday, July 20, 2008
The Possible Demise of the Great US of A (Part I)
Is the oil story finally over?
I apologise for the late entry. Before I move on to the main topic, I shall discuss about this week where we saw a great rally for the for the week and a weakening oil price.
Sadly, the answer to the question above is no in my opinion.
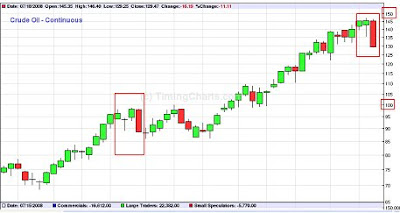
To me, the behaviour of oil price as it approaches $150 mark is similar to the time when it marches towards the $100 mark. It is not a topping chart yet. But oil could still go lower, just that in the long run, I believe it will continue to move higher.
Is it a bottom?
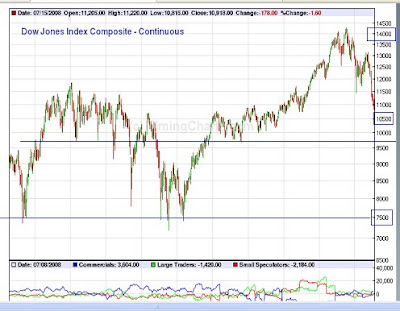
We had a significant day where DJI closed below 11000. For the rest of the week, the market rallied on strong earning from the financials.
Again, my answer is no.

1. A bottom should always end with a panic sell out. Not necessary a market crash, but a strong top down punch to the market that to some extent brings the crowd back to believe that it is time for bargain hunting.
2. This is a weekly chart. It will actually be clearer if you take a look at the daily chart. But because of the time scale, the graph will not be visible on the post. Aug 16 marks the end of the July subprime correction. It was a day with a panic sell down and a late rally. Take note that the big swing was all in a day's work. The long leg you see was due to Aug 16.
3. Looking back at a more recent date - Jan 22. We have futures down some 400-500 points. Emergency rate cut saves the day, DJI closes down some 100 points in the end. Some may argue that March was actually the real bottom based on the chart above but the opening of Jan 22 was much lower than March lows. It was just that the market rallied too fast for its own good and it was punished with another selldown for few weeks after Jan 22.
4. Now if you look at this week, similar to both bottoms, we have a leg down (though it is actually a short leg). What concerns me was actually the open. Compare to the other two, this week opens stronger. Jul 15 was the day we penetrated through 11000. The low of the day was some 280 off Jul 14 close. We rallied back to just down 100 points. It was not actually a panic sell off. Well some people look at this thing called VIX - the fear indicator. I don't actually. I look at the numbers. The magnitude of the sell off was not great. What's 300 points? It's too little to be considered a sell off.
Performance to date
Horrible is the word that sums it all. I actually cover AMR, FNM, FRE on monday because they were too low for me to consider holding. But that was not enough apparently. My portfolio would have been close to even had I not leveraged it to some 250%. Added a lot more shorts using margin and the rest is history. But I'm still holding some of my short position. Too embarrassing to show it.
The Great US of A
Some background information
1. Total American Debt = $55 trillion (300-400% of GNP). You can find this easily actually.
2. Federal Debt = $9.5 trillion. They have a debt limit of $9.815 trillion.
3. Debt of America at Great Depression was 170% of GNP.
Honestly, how do you pay back $9.5 trillion? To understand how big a trillion is, you may look at it this way: it's the year 0, the beginning of the first millennium and you have a trillion dollars to spend at the rate of a million dollars a day. Keep spending till 2008, you still have 730 years to go, spending a million a day before you reach the end of your money pile. at Annual deficits add on to this number. We all know that US is an importer nation and the trade deficit just keeps adding on to it. Buffet explains trade deficit in an interesting manner. Obviously, US will not sell away their land. Maybe, they will print more money. If you draw an analogy between the US and the Weimar Republic, you will be pretty amazed.
Kondratieff Wave
1. It’s a long cycle of approximately 60 years. The first half of the cycle is a rising economy, followed by a plateau period, and the last quarter is a deflationary depression. I’ve divided the cycle into the four seasons of the year. Spring is the rebirth of the economy, summer is when it reaches its fruition, autumn is the feel-good period, and winter is when the economy dies. The onset of each of the seasons is indicated by either a bear market bottom or a bull market top in stock prices.
2. A theory on cycles. I'm not really an economics kind of person but I believe in cycles because human nature never changes. If our nature do not change, then history simply repeats itself. We will have a world war 3! Alright this is too far-fetched. I don't really mean that actually. But what I'm seeing now is a possible 2nd Great Depression.
3. The K-Wave theory is used to explain the rise and fall of superpowers (click the link for a table of past superpowers and their timeline). To some extent, if you look at I-ching (chinese philosophy), the first diagram "qian", coincides with the cycle theory and the rise and fall of a "dragon". Dragon is seen superior in Chinese Culture. In the "qian" diagram, they talk about the fall of the dragon as the final stage because of complacency. The dot.com bubble and the subprime crisis are two very good examples that exemplify men's complancency.
4. This is a table that I get from here. Another article about the K-wave theory. It is said that we are in the winter period of the cycle right now that begins in 2000. But stock market has been doing pretty well since. If year 2000 is the onset of the winter, then what we are seeing now is probably prolong of the winter due to credit expansion, resulting in a bear market rally.
5. After some 18 years of bull run, stocks began to look vulnerable with the speculation of dot.com bubble. When we did get that peak and the Nasdaq started to collapse, [former Fed chairman Alan] Greenspan panicked and brought interests down from 6% to 1%. He flooded the banking system with money, easy credit fostered another big boom in real estate, and stocks followed because so much money was available. The stock market loves low interest rates.
6. Sadly, in a bid to save one of the biggest equity bubble in history, Greenspan creates one of the biggest asset bubble in history which is now leading to the biggest credit crisis in history. Ouch. Smart of him to step down and throw everything to Ben Bernanke. Well you can read a book titled "Greenspan Bubbles". It is an anti-greenspan book to be honest.
Austrian School of Economics
There were many reasons for great depression. Debt was one of them. However, I was fascinated by the Austrian School. There is no means of avoiding the final collapse of a boom brought about by credit expansion. The question is only whether the crisis should come sooner as a result of a voluntary abandonment of further credit expansion, or later as a final and total catastrophe of the currency system - Ludwig von Mises
The key word here is credit expansion. In the Austrian view it was this inflation of the money supply that led to an unsustainable boom in both asset prices (stocks and bonds) and capital goods.
From what I learn in my history textbook, it mentions that speculation drove the stock market to an unsustainable value and in the end the stock market collapsed. Depression is the aftermath of credit expansion.
Bringing the focus back on credit expansion. Credit expansion creates the appearance of a larger supply of capital and serves to reduce the market rate of interest below what it would otherwise be. To put in simple words, money appears out of nowhere. Do you get the hint I'm throwing to you?
Fuzzy Logic
It's time for some fuzzy logic. Let's talk about cycles. To understand what's Greenspan doing, I have to draw some graphs.
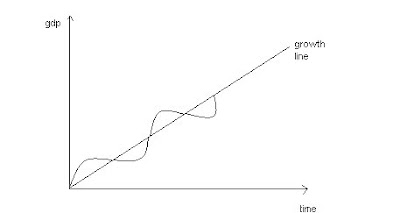 Alright my drawing isn't that good with windows paint. Ignore that please. Supposed we have a upward trending growth line. Our movement along this growth line will be something like a sinusoidal curve. Crest will represent excess capacity and trough will represent the return of pricing powers. We will experience downturns but these downturns are beneficial for the economy because they clear out the excess in the system for the greater good.
But what the US or Greenspan has done is represented in the graph below.
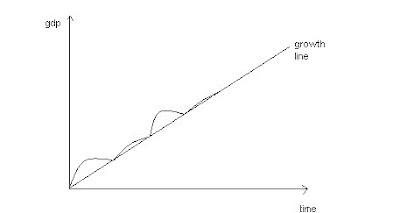 By saving the economy when it approaches the trough, Greenspan is effectively keeping all the excess capacity in the economy which are not beneficial to the economy and will be cleared out sooner or later.
Forest Fires
I will use another analogy - Forest Fires. I learn this from Jim Rogers actually. Forest fires occur in nature as an act to clear out the excess. Dry leaves, dying woods are all burnt and decomposed, thus laying a good foundation for the remaining to grow and become more robust than before. However, if men were to put out forest fires everytime we see one, the excess accumulates. Sooner or later, the excess gets real huge and once a fire starts, men cannot put it out anymore. P.S: mailman added this actually.
The World Financial Crisis
Subprime was a virtually unknown word until Bear Sterns came out and announced the closure of two hedge funds. But to many experts, subprime mortgage was a time bomb that was ready to burst. I believe, for many years to come, a new financial term will trigger off the world's largest financial crisis ever, probably leading to the complete meltdown of the world banking system. Buffett calls them "weapons of mass destruction" (article on buffett) - Derivatives.
I believe that the trigger for the next depression is this.
Derivatives are financial instruments whose value changes in response to the changes in underlying variables. The main types of derivatives are futures, forwards, options, and swaps. The main use of derivatives is to reduce risk for one party. But this tool has turned the whole financial system into a huge gambling den.
A better understanding of Derivatives
The original article is here. I will do a summary actually. There are two types of derivatives, namely exchange traded and over-the-counter derivatives.
"Let me give an example. Suppose Bank B buys an OTC derivative linked to oil prices from Bank A. And then later the same day, it decides to double its oil exposure, but this time it buys oil futures. To make the example fully congruent, let's assume that the futures bought by bank B were sold by bank A. A week later, the oil price rises, and the bank decides to take profits. It may then sell a same size oil derivative to bank C, and also sells the oil futures on the exchange. Again, we assume that bank C bought the oil futures.
Speaking of Bear Sterns, they have an net exposure of $13 trillion in these derivatives. JP Morgan Chase had the largest exposure of all American Banks with $78 trillion. A cause for the astronomical value of the OTCs could be attributed to the legend "Alan Greenspan" for making money too easy to obtain. A good read here. Many pdfs over there, Winter warning volume 2 issue 3 is about OTC.
Of course no firms with large exposure in the derivatives market can fail, but how many can the Fed bail out? How do they go about doing it? Print more money and let the dollar plunge even more? The very reason why we have such high oil prices could be due to the weak dollar.
My point is...
It comes down to the rise and fall of a great nation. US has been a global leader for many years and somehow (fated?), they may fall in the future because of the trade deficits that continue to increase every single year and the misuse of credit. All these are signs of complacency. It is also a culture there isn't it? A credit nation that spends their future money. Even the war is on credit. Maybe there is some conspiracy theory in play, I don't know. There were some rumours about a new currency Amero. It is pretty much obvious that the dollar has to go as the world reserve currency. There is no way they can repay those debt in my opinion other than to print more money.
They prolong the "winter" period by creating another bubble and in the end, they will have to face the final catastrophe. The only way to negate credit expansion is obviously credit contraction which leads to deflation and a possible depression.
The OTC derivatives bubble could be the last and final bubble that dissolve the world banking system. Derivatives are not real assets after all, they are paper money. No one knows when will this bubble burst and where it will come from. But it will burst eventually because people get complacent and have abused it.
When I look back at this chart again, I just see an impending stock market doom. The fact that Buffett named the last centry as the "wonderful century" and that it would bring the Dow points to 2000000 if they were to repeat the last centry performance, shows that he has some worry about the perfomance of the market in the future. Buffett is a conservative man and usually he is very tactful with his words. I am just inferring from them.
If we wait for a complete head and shoulders to form, it could be 5-10 years time in the future. We could possibly see a bottom this year or early next year and go through a last bull run that probably last for another 3-5 years like the previous one did because of housing. Then we will see the final leg down to the stock market. How low can it go? During the great depression, the market lost 90% of its value but it shouldn't be that bad because companies are more global now. Nonetheless, I could see a period of time where depression happens and everyone will hate stocks. Many will criticize me, but this is my stand. Call me a natural bear or something, I believe we will see a 2nd great depression.
As to who will be the next superpower? India or China? I'm a chinese but I don't know if it will be China. There is a reason why the chinese has war all the time. Eunuch Zheng Ho had the biggest fleet of ships at one point of time that can only be matched by those in World War II. But they never conquer the world.
I will probably be doing a Part II. So do keep a look out for it. Lots of reading for this post but they are very important.
P.S: glad to see that I have visitors returning frequently on sunday and saturday to check for the update. Apologies for the late entry.
Depression is the aftermath of credit expansion
Ludwig von Mises
I apologise for the late entry. Before I move on to the main topic, I shall discuss about this week where we saw a great rally for the for the week and a weakening oil price.
Sadly, the answer to the question above is no in my opinion.

To me, the behaviour of oil price as it approaches $150 mark is similar to the time when it marches towards the $100 mark. It is not a topping chart yet. But oil could still go lower, just that in the long run, I believe it will continue to move higher.
Is it a bottom?
We had a significant day where DJI closed below 11000. For the rest of the week, the market rallied on strong earning from the financials.
Again, my answer is no.

1. A bottom should always end with a panic sell out. Not necessary a market crash, but a strong top down punch to the market that to some extent brings the crowd back to believe that it is time for bargain hunting.
2. This is a weekly chart. It will actually be clearer if you take a look at the daily chart. But because of the time scale, the graph will not be visible on the post. Aug 16 marks the end of the July subprime correction. It was a day with a panic sell down and a late rally. Take note that the big swing was all in a day's work. The long leg you see was due to Aug 16.
3. Looking back at a more recent date - Jan 22. We have futures down some 400-500 points. Emergency rate cut saves the day, DJI closes down some 100 points in the end. Some may argue that March was actually the real bottom based on the chart above but the opening of Jan 22 was much lower than March lows. It was just that the market rallied too fast for its own good and it was punished with another selldown for few weeks after Jan 22.
4. Now if you look at this week, similar to both bottoms, we have a leg down (though it is actually a short leg). What concerns me was actually the open. Compare to the other two, this week opens stronger. Jul 15 was the day we penetrated through 11000. The low of the day was some 280 off Jul 14 close. We rallied back to just down 100 points. It was not actually a panic sell off. Well some people look at this thing called VIX - the fear indicator. I don't actually. I look at the numbers. The magnitude of the sell off was not great. What's 300 points? It's too little to be considered a sell off.
Performance to date
Horrible is the word that sums it all. I actually cover AMR, FNM, FRE on monday because they were too low for me to consider holding. But that was not enough apparently. My portfolio would have been close to even had I not leveraged it to some 250%. Added a lot more shorts using margin and the rest is history. But I'm still holding some of my short position. Too embarrassing to show it.
The Great US of A
Some background information
1. Total American Debt = $55 trillion (300-400% of GNP). You can find this easily actually.
2. Federal Debt = $9.5 trillion. They have a debt limit of $9.815 trillion.
3. Debt of America at Great Depression was 170% of GNP.
Honestly, how do you pay back $9.5 trillion? To understand how big a trillion is, you may look at it this way: it's the year 0, the beginning of the first millennium and you have a trillion dollars to spend at the rate of a million dollars a day. Keep spending till 2008, you still have 730 years to go, spending a million a day before you reach the end of your money pile. at Annual deficits add on to this number. We all know that US is an importer nation and the trade deficit just keeps adding on to it. Buffet explains trade deficit in an interesting manner. Obviously, US will not sell away their land. Maybe, they will print more money. If you draw an analogy between the US and the Weimar Republic, you will be pretty amazed.
Kondratieff Wave
1. It’s a long cycle of approximately 60 years. The first half of the cycle is a rising economy, followed by a plateau period, and the last quarter is a deflationary depression. I’ve divided the cycle into the four seasons of the year. Spring is the rebirth of the economy, summer is when it reaches its fruition, autumn is the feel-good period, and winter is when the economy dies. The onset of each of the seasons is indicated by either a bear market bottom or a bull market top in stock prices.
2. A theory on cycles. I'm not really an economics kind of person but I believe in cycles because human nature never changes. If our nature do not change, then history simply repeats itself. We will have a world war 3! Alright this is too far-fetched. I don't really mean that actually. But what I'm seeing now is a possible 2nd Great Depression.
3. The K-Wave theory is used to explain the rise and fall of superpowers (click the link for a table of past superpowers and their timeline). To some extent, if you look at I-ching (chinese philosophy), the first diagram "qian", coincides with the cycle theory and the rise and fall of a "dragon". Dragon is seen superior in Chinese Culture. In the "qian" diagram, they talk about the fall of the dragon as the final stage because of complacency. The dot.com bubble and the subprime crisis are two very good examples that exemplify men's complancency.

4. This is a table that I get from here. Another article about the K-wave theory. It is said that we are in the winter period of the cycle right now that begins in 2000. But stock market has been doing pretty well since. If year 2000 is the onset of the winter, then what we are seeing now is probably prolong of the winter due to credit expansion, resulting in a bear market rally.
5. After some 18 years of bull run, stocks began to look vulnerable with the speculation of dot.com bubble. When we did get that peak and the Nasdaq started to collapse, [former Fed chairman Alan] Greenspan panicked and brought interests down from 6% to 1%. He flooded the banking system with money, easy credit fostered another big boom in real estate, and stocks followed because so much money was available. The stock market loves low interest rates.
6. Sadly, in a bid to save one of the biggest equity bubble in history, Greenspan creates one of the biggest asset bubble in history which is now leading to the biggest credit crisis in history. Ouch. Smart of him to step down and throw everything to Ben Bernanke. Well you can read a book titled "Greenspan Bubbles". It is an anti-greenspan book to be honest.
Austrian School of Economics
There were many reasons for great depression. Debt was one of them. However, I was fascinated by the Austrian School. There is no means of avoiding the final collapse of a boom brought about by credit expansion. The question is only whether the crisis should come sooner as a result of a voluntary abandonment of further credit expansion, or later as a final and total catastrophe of the currency system - Ludwig von Mises
The key word here is credit expansion. In the Austrian view it was this inflation of the money supply that led to an unsustainable boom in both asset prices (stocks and bonds) and capital goods.
From what I learn in my history textbook, it mentions that speculation drove the stock market to an unsustainable value and in the end the stock market collapsed. Depression is the aftermath of credit expansion.
Bringing the focus back on credit expansion. Credit expansion creates the appearance of a larger supply of capital and serves to reduce the market rate of interest below what it would otherwise be. To put in simple words, money appears out of nowhere. Do you get the hint I'm throwing to you?
Fuzzy Logic
It's time for some fuzzy logic. Let's talk about cycles. To understand what's Greenspan doing, I have to draw some graphs.
 Alright my drawing isn't that good with windows paint. Ignore that please. Supposed we have a upward trending growth line. Our movement along this growth line will be something like a sinusoidal curve. Crest will represent excess capacity and trough will represent the return of pricing powers. We will experience downturns but these downturns are beneficial for the economy because they clear out the excess in the system for the greater good.
But what the US or Greenspan has done is represented in the graph below.
 By saving the economy when it approaches the trough, Greenspan is effectively keeping all the excess capacity in the economy which are not beneficial to the economy and will be cleared out sooner or later.
Forest Fires
I will use another analogy - Forest Fires. I learn this from Jim Rogers actually. Forest fires occur in nature as an act to clear out the excess. Dry leaves, dying woods are all burnt and decomposed, thus laying a good foundation for the remaining to grow and become more robust than before. However, if men were to put out forest fires everytime we see one, the excess accumulates. Sooner or later, the excess gets real huge and once a fire starts, men cannot put it out anymore. P.S: mailman added this actually.
The World Financial Crisis
Subprime was a virtually unknown word until Bear Sterns came out and announced the closure of two hedge funds. But to many experts, subprime mortgage was a time bomb that was ready to burst. I believe, for many years to come, a new financial term will trigger off the world's largest financial crisis ever, probably leading to the complete meltdown of the world banking system. Buffett calls them "weapons of mass destruction" (article on buffett) - Derivatives.
I believe that the trigger for the next depression is this.
Derivatives are financial instruments whose value changes in response to the changes in underlying variables. The main types of derivatives are futures, forwards, options, and swaps. The main use of derivatives is to reduce risk for one party. But this tool has turned the whole financial system into a huge gambling den.
A better understanding of Derivatives
The original article is here. I will do a summary actually. There are two types of derivatives, namely exchange traded and over-the-counter derivatives.
Exchange traded derivatives – these are futures or options contracts traded on an exchange. Like all derivatives, they are contracts whose prices are DERIVED from the price of a physical commodity, or a financial instrument such as a bond. The important thing is what party is the contracting party. With exchange traded derivatives, the party that is responsible for honouring the contract is the exchange itself.
Over-the-Counter (OTC) derivatives – these are contracts between professional counterparties themselves, such as two banks, or a bank and its corporate client, without an exchange in the middle.
Exchange traded derivatives are not the main concern in my opinion because there is no counter-partying risk since you are dealing with the exchange itself. OTC derivatives are the real time bomb. I copied a very good example from the article below."Let me give an example. Suppose Bank B buys an OTC derivative linked to oil prices from Bank A. And then later the same day, it decides to double its oil exposure, but this time it buys oil futures. To make the example fully congruent, let's assume that the futures bought by bank B were sold by bank A. A week later, the oil price rises, and the bank decides to take profits. It may then sell a same size oil derivative to bank C, and also sells the oil futures on the exchange. Again, we assume that bank C bought the oil futures.
So we have:
• Bank A's derivative – sold to bank B – later, resold to bank C
• Bank A's future..... – sold to bank B – later, resold to bank C
Now what accounting trail has been left from these two similar transactions? The OTC derivative will remain on bank B's books. In fact, it will have two transactions remaining on its books:
• Long : OTC oil derivative (with Bank A)
• Short: OTC oil derivative (with Bank C)
The netted out exposure to oil price risk may be zero, but there remains an oil-linked credit exposure which is now twice as big, because there is one on both the long and short side of the trade. Banks normally carry these risks until the maturity of the OTC derivatives contract, and the final settlement has been made."
The notional value of all the OTC derivatives exceed $500 trillion. I repeat $500,000,000,000,000. Fourteen big fat zeroes! But this number is probably exaggerated because there is some double counting. Some positions are winning, some are losing and if you net them out, you actually get the net profit/loss which shows a much lower net exposure. Nonetheless, the problem is still a very huge one. Supposed a big player in these derivatives go bust as Bear Sterns threatened to do so in March, that would trigger an early forced-settlement of all those still unexpired OTC derivatives trades. In a mass default, various unhelpful and disruptive actions would be taken by parties aiming to protect their positions, and/or benefit from the chaos.Speaking of Bear Sterns, they have an net exposure of $13 trillion in these derivatives. JP Morgan Chase had the largest exposure of all American Banks with $78 trillion. A cause for the astronomical value of the OTCs could be attributed to the legend "Alan Greenspan" for making money too easy to obtain. A good read here. Many pdfs over there, Winter warning volume 2 issue 3 is about OTC.
Of course no firms with large exposure in the derivatives market can fail, but how many can the Fed bail out? How do they go about doing it? Print more money and let the dollar plunge even more? The very reason why we have such high oil prices could be due to the weak dollar.
My point is...
It comes down to the rise and fall of a great nation. US has been a global leader for many years and somehow (fated?), they may fall in the future because of the trade deficits that continue to increase every single year and the misuse of credit. All these are signs of complacency. It is also a culture there isn't it? A credit nation that spends their future money. Even the war is on credit. Maybe there is some conspiracy theory in play, I don't know. There were some rumours about a new currency Amero. It is pretty much obvious that the dollar has to go as the world reserve currency. There is no way they can repay those debt in my opinion other than to print more money.
They prolong the "winter" period by creating another bubble and in the end, they will have to face the final catastrophe. The only way to negate credit expansion is obviously credit contraction which leads to deflation and a possible depression.
The OTC derivatives bubble could be the last and final bubble that dissolve the world banking system. Derivatives are not real assets after all, they are paper money. No one knows when will this bubble burst and where it will come from. But it will burst eventually because people get complacent and have abused it.

When I look back at this chart again, I just see an impending stock market doom. The fact that Buffett named the last centry as the "wonderful century" and that it would bring the Dow points to 2000000 if they were to repeat the last centry performance, shows that he has some worry about the perfomance of the market in the future. Buffett is a conservative man and usually he is very tactful with his words. I am just inferring from them.
If we wait for a complete head and shoulders to form, it could be 5-10 years time in the future. We could possibly see a bottom this year or early next year and go through a last bull run that probably last for another 3-5 years like the previous one did because of housing. Then we will see the final leg down to the stock market. How low can it go? During the great depression, the market lost 90% of its value but it shouldn't be that bad because companies are more global now. Nonetheless, I could see a period of time where depression happens and everyone will hate stocks. Many will criticize me, but this is my stand. Call me a natural bear or something, I believe we will see a 2nd great depression.
As to who will be the next superpower? India or China? I'm a chinese but I don't know if it will be China. There is a reason why the chinese has war all the time. Eunuch Zheng Ho had the biggest fleet of ships at one point of time that can only be matched by those in World War II. But they never conquer the world.
I will probably be doing a Part II. So do keep a look out for it. Lots of reading for this post but they are very important.
P.S: glad to see that I have visitors returning frequently on sunday and saturday to check for the update. Apologies for the late entry.
Depression is the aftermath of credit expansion
Ludwig von Mises
Wednesday, July 16, 2008
Mid Week Pit Stop #13
Chart reading is a funny art actually. You can get 50 people to read the same chart and get 50 different answer. So just take a look, read what I say and probably do your own analysis.
Part 1

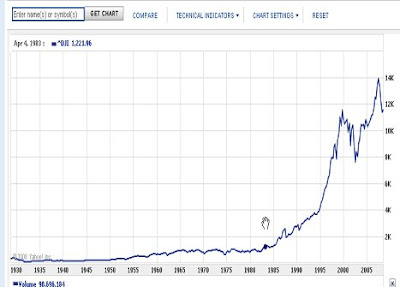
Got this from yahoo! finance. I shall do some advertising for them, they are in a pretty bad shape. =D
Alright back onto the chart. Some repetitions from previous posts actually but they are important points to take note.
1. Nice long bull run since 1982
2. First Peak in late 1999
3. Bottom out in 2002 at about 7500
4. Some stagnation from 2003-2004
5. Wonderful bull burst to 14000
6. Down we go
So where's the support? Well, the first thing I look at is a whole number. Makes things easy. Not very accurate actually but at least it provides a guideline. So somehow, 10k catches a lot of attention. Looking back into history to see what happen at 10k before, we see some form of consolidation. We see that Dow broke 10k and had a pull back to the 10k mark, tested it and found a rock solid platform.
Conclusion - 10k support. But is that all?
Well I reduce the timeline slight and concentrate on the two peaks. To some extent the first picture was rather useless but it was important for the third part of this post.
Points to take note
1. A bottom at 7500 and a top at 14000.
2. Take some 50% retracement(elliot wave theory) we get 10250 (I round it up to 10500). But I can't see anything at 10500. It just doesn't appeal to me. I watch a video on cnbc talking about 10566 as a magic number. Honestly I think that's bullshit.
3. Somehow you could see a support at about 9750. To be on the safe side, we take it at 9500. This has suddenly become interesting.
Conclusion - 9500 but why?
Part 2
Here, I wish to introduce a theory that I believe in - Damping. Not a very good picture. Now, superimpose this image onto the chart above where dow rises from the bottom of 7500 and breaks 10000. It does not just stop at 10000. It surpasses it to somewhere about 10500 and comes back down. So now do u get the idea of 9500? Reverse the image in your mind and you will get the idea.
I admit this is a fuzzy logic. But if you apply this to the 11500 bottom we see at the opening for march low, think of the emergency fed meeting and how we rally back up to 11900 and subsequently move around the level of 12000, you will actually get a clearer picture of how all the events are strung together in retropect.
Part 3
I always talk about the Big Picture. This part is more for what I'm going to say for the weekend. I like to pre-empt. Most chartist will just look for a full formation to take place and decide what to do. But I see it differently, I tend to look ahead (no basis actually).
If you were to look back at the 1st chart, you would notice two peaks with the latter higher than the first. The first shape that comes to my mind is a super huge Head and Shoulders formation that takes some 10 or more years to complete. We are just finished with the Head portion right now and there is definitely a possibility of a potential right shoulder next.
This head and shoulders formation might be a real disastrous one. With all the problems we are facing right now, who knows?
Conclusion
Charts are still charts after all. Most people critcise them because it's based on hindsight. But a picture does tell more sometimes. As of now, I think dow will seek a bottom at 9500 to 9750. It is possible that we break 9500 fast and head straight to 7500-8000. But we can decide later on when dow really heads towards 9500.
Be sure to look out for weekend's post. As of now, cya.
I can measure the motion of the heavenly bodies, but not the madness of the crowds.
Sir Isaac Newton
Part 1

Got this from yahoo! finance. I shall do some advertising for them, they are in a pretty bad shape. =D
Alright back onto the chart. Some repetitions from previous posts actually but they are important points to take note.
1. Nice long bull run since 1982
2. First Peak in late 1999
3. Bottom out in 2002 at about 7500
4. Some stagnation from 2003-2004
5. Wonderful bull burst to 14000
6. Down we go
So where's the support? Well, the first thing I look at is a whole number. Makes things easy. Not very accurate actually but at least it provides a guideline. So somehow, 10k catches a lot of attention. Looking back into history to see what happen at 10k before, we see some form of consolidation. We see that Dow broke 10k and had a pull back to the 10k mark, tested it and found a rock solid platform.
Conclusion - 10k support. But is that all?

Well I reduce the timeline slight and concentrate on the two peaks. To some extent the first picture was rather useless but it was important for the third part of this post.
Points to take note
1. A bottom at 7500 and a top at 14000.
2. Take some 50% retracement(elliot wave theory) we get 10250 (I round it up to 10500). But I can't see anything at 10500. It just doesn't appeal to me. I watch a video on cnbc talking about 10566 as a magic number. Honestly I think that's bullshit.
3. Somehow you could see a support at about 9750. To be on the safe side, we take it at 9500. This has suddenly become interesting.
Conclusion - 9500 but why?
Part 2
Here, I wish to introduce a theory that I believe in - Damping.
 Not a very good picture. Now, superimpose this image onto the chart above where dow rises from the bottom of 7500 and breaks 10000. It does not just stop at 10000. It surpasses it to somewhere about 10500 and comes back down. So now do u get the idea of 9500? Reverse the image in your mind and you will get the idea.
I admit this is a fuzzy logic. But if you apply this to the 11500 bottom we see at the opening for march low, think of the emergency fed meeting and how we rally back up to 11900 and subsequently move around the level of 12000, you will actually get a clearer picture of how all the events are strung together in retropect.
Part 3
I always talk about the Big Picture. This part is more for what I'm going to say for the weekend. I like to pre-empt. Most chartist will just look for a full formation to take place and decide what to do. But I see it differently, I tend to look ahead (no basis actually).
If you were to look back at the 1st chart, you would notice two peaks with the latter higher than the first. The first shape that comes to my mind is a super huge Head and Shoulders formation that takes some 10 or more years to complete. We are just finished with the Head portion right now and there is definitely a possibility of a potential right shoulder next.
This head and shoulders formation might be a real disastrous one. With all the problems we are facing right now, who knows?
Conclusion
Charts are still charts after all. Most people critcise them because it's based on hindsight. But a picture does tell more sometimes. As of now, I think dow will seek a bottom at 9500 to 9750. It is possible that we break 9500 fast and head straight to 7500-8000. But we can decide later on when dow really heads towards 9500.
Be sure to look out for weekend's post. As of now, cya.
I can measure the motion of the heavenly bodies, but not the madness of the crowds.
Sir Isaac Newton
Saturday, July 12, 2008
The F word
Alright I am trying to be funny. Why F word? Certainly I'm not talking about the brand Fcuk. I'm talking about Fannie, Freddie, Finanicals and the Fed.
About the week
1.Highlight of the week is definitely F related. On friday (omg F!!!), we have fannie and freddie plunged some 40% during pre-market trading. Just to give you some background knowledge, Fannie and Freddie own or guarantee $5 trillion of debt, close to half of all U.S. mortgages (alternatively, you can read on cnbc.com). I will just throw you the number.
5 trillion. Yes that's 5,000,000,000,000. Imagine a 1% default. 50 billion.
But Fannie closed 22.5% in the end and Freddie was down some 3% on friday.
2. Highlight no.2 has to go to the o-word. Oil. Well, oil was down some $9 in two days and it reversed the loss and made a record price before settling at $144.
3. So how bad did the market do? Dow ended down -188 for the week. Seriously, with oil making record price, possible collapse of the two biggest US home-mortgage financing companies, we are only down near 2% for the week. Blessing in disguise? Bottom? or an impending doom? You know my stand.
Some thoughts on the Fed
I was watching cnbc and actually heard an interesting thing about the Fed. Apparently they added a new mandate to the Fed and that is to help in financials' stability. In regard to Fannie and Freddie, what should the Fed do actually?
Personally, I don't think the Fed has that much money to salvage the situation. They can start switching on their money printing machine again of course to save them but believe me, it will be disastrous in the future if they continue printing more money. When it comes to a point where they are printing more money to print money (it's a joke among my friends, just means if dollar weakens really badly and inflation is horrible), you don't wish to know what will happen.
Looking Forward
1. I think the Fed will do something over the weekend just like what they did with Bear Sterns. I covered my Fannie Mae actually because I dont know what will happen.
2. Earnings wise, we have the following.
4. For the locals, there is a hotshot warrant competition over here. Worth a try to actually aim for the top prize. I will probably keep my mouth shut on what I am going to do. LOL hope I can win it.
5. We have about three more weeks to the next Fed meeting. I'm waiting for that day.
6. Buy gold. Period.
7. I'm pretty unsatisfied with the quality of recent posts. Quite busy these few days actually doing some research and getting myself prepared for the warrant competition. Next week posts will be good and I can assure you that. Mid week will be about back on charting on the Dow and how low I think Dow can go. On the weekend, it's a huge project that I have been working on with the mailman in particular - THE DEMISE OF THE GREAT USA NATION.
Performance to date
About the week
1.Highlight of the week is definitely F related. On friday (omg F!!!), we have fannie and freddie plunged some 40% during pre-market trading. Just to give you some background knowledge, Fannie and Freddie own or guarantee $5 trillion of debt, close to half of all U.S. mortgages (alternatively, you can read on cnbc.com). I will just throw you the number.
5 trillion. Yes that's 5,000,000,000,000. Imagine a 1% default. 50 billion.
But Fannie closed 22.5% in the end and Freddie was down some 3% on friday.
2. Highlight no.2 has to go to the o-word. Oil. Well, oil was down some $9 in two days and it reversed the loss and made a record price before settling at $144.
3. So how bad did the market do? Dow ended down -188 for the week. Seriously, with oil making record price, possible collapse of the two biggest US home-mortgage financing companies, we are only down near 2% for the week. Blessing in disguise? Bottom? or an impending doom? You know my stand.
Some thoughts on the Fed
I was watching cnbc and actually heard an interesting thing about the Fed. Apparently they added a new mandate to the Fed and that is to help in financials' stability. In regard to Fannie and Freddie, what should the Fed do actually?
Personally, I don't think the Fed has that much money to salvage the situation. They can start switching on their money printing machine again of course to save them but believe me, it will be disastrous in the future if they continue printing more money. When it comes to a point where they are printing more money to print money (it's a joke among my friends, just means if dollar weakens really badly and inflation is horrible), you don't wish to know what will happen.
Looking Forward
1. I think the Fed will do something over the weekend just like what they did with Bear Sterns. I covered my Fannie Mae actually because I dont know what will happen.
2. Earnings wise, we have the following.
Among the financials Charles Schwab, State Street and US Bancorp report Tuesday. Northern Trust and Wells Fargo report Wednesday. BlackRock, JPMorgan Chase, Merrill Lynch, PNC, Bank of New York Mellon and CIT Group report Thursday. On Friday, Citigroup reports.
Big techs reporting include Intel on Tuesday. EBay reports Wednesday and Google, IBM and Microsoft report Thursday. AMR and Delta Airlines report Wednesday and Continental reports Thursday.
3. Actually, I think the financials are pretty quiet these few days. Calm before the storm? I doubled my shorts of all the financials.4. For the locals, there is a hotshot warrant competition over here. Worth a try to actually aim for the top prize. I will probably keep my mouth shut on what I am going to do. LOL hope I can win it.
5. We have about three more weeks to the next Fed meeting. I'm waiting for that day.
6. Buy gold. Period.
7. I'm pretty unsatisfied with the quality of recent posts. Quite busy these few days actually doing some research and getting myself prepared for the warrant competition. Next week posts will be good and I can assure you that. Mid week will be about back on charting on the Dow and how low I think Dow can go. On the weekend, it's a huge project that I have been working on with the mailman in particular - THE DEMISE OF THE GREAT USA NATION.
Performance to date
| Name | Price shorted ($) | Current price ($) | % Change |
| Lehman Bro | 24.15 | 14.43 | -40.25 |
| General Motors | 13.99 | 9.92 | -29.09 |
| AMR | 6.22 | 4.75 | -23.63 |
| Citigroup Inc | 19.40 | 16.19 | -16.55 |
| Fannie Mae* | 21.51 | 8.30 | -62.4 |
| AIG | 27.82 | 23.08 | -17.04 |
| Capitaland | 5.85 | 5.82 | Pathetic |
| CityDev | 10.20 | 11.22 | HOLY +10 |
| SGX | 7.16 | 6.97 | -3.5 |
| Commodities | Price bought ($) | Current price ($) | Profit/loss ($) |
| Gold | 884.80 | 965.9 | 81.10 |
| Oil | 135.15 | 144.55 | 9.60 |
Alright, I can't fix the table problem. Btw, 1 contract on gold will yield you a 100% return by now.
Wednesday, July 9, 2008
Mid Week Pit Stop #12
Surprisingly there is a hindenburg omen video on cnbc.com. Not really a new thing actually if you have been reading the blog. Just for those with slightly more interest in it, you can view it from here.
Back to Technical Analysis
Well, I have touched on Head and Shoulders with pit stop #10, side track a little with pit stop #11 because I really want to mention it as quickly as possible. Here again, I will introduce new patterns. I am not a very technical guy so to speak. As much as I use them, I disagree with a good part of technical analysis actually especially the indicators.
Triangles
By right, there are three types of triangle patterns. They are ascending triangles, descending triangles and symmetrical triangle. I don't really like symmetrical triangle because they are not biased to any side, which means that you have to be really careful.
 There are many pictures that you can find on the internet for triangles in technical analysis. I like this picture because of the thumb up icon over there. Ascending triangle and descending triangle are just opposite in nature.
What does this chart show actually?
1. Triangles tell you about specific price behaviour and possible mentality of the crowd. First you have a stock that is going on an uptrend. It faces some sort of resistance or profit taking or whatever reason you can find for it falling down. Reasons do not matter actually. It's the behaviour that matters.
2. After falling quite significantly, it goes back up to test the previous resistance point but to no avail. However, it does not fall as much as before this time round.
3. Buying forces are gathering fast, possibly anxious, to buy into the stock that they miss before at a cheaper price.
4. The process many repeats a few more times with buyers buying at a higher price each time it falls from the resistance point (thus forming the lower rising trendline).
5. Finally, the stock breaks its resistance and shoots immediately as more buyers come in.
6. In my own fuzzy logic words, triangle is similar to punching a wooden block. A soft wood of course. After punching it many times, the wood gets weaker and finally when it comes down to the final punch, your punch will go through and not just stop at the position of the wood itself. Sounds fuzzy isn't it?
If you are interested to read more into triangles, you can read from here. The website provides detailed explanation (lengthy).
Again, some posts will be short in order to balance those super long post. I have one long post coming up, a very audacious post that I will be working on with the mailman. I don't think that we can rush it out for this weekend post so it is most likely to be for next week post.
Do not buy the hype from Wall St. and the press that stocks always go up. There are long periods when stocks do nothing and other investments are better.
Jim Rogers
Thursday, July 3, 2008
After the gold rush
"After the gold rush" is actually a song by Neil Young. Nice song actually. Alright this is not a music post, what I want to highlight is the magical word there - GOLD.
Before I begin...
"Chart traders have no reason not to continue buying, at this point. The crude oil chart presents a classic bullish picture with more to go." Quoted from this article by John Kilduff on cnbc.com.
"$150 crude oil seems a virtual certainty, but it may prove as fleeting as a snow cone on a hot summer day."
He also added another statement to cover both side of oil story. But the thing I want to point out is the phrase that he uses - a classic bullish picture. Well, you remember a post 6 weeks ago (I'm lazy to find it), he says that oil was showing a topping chart. In 6 weeks alone, a topping chart has turned into a CLASSIC BULLISH picture, how amazing is that? =)
John P. Kilduff Senior Vice President Of Energy at MF Global Ltd.
Gold and more Gold
I urge most of you out there to buy gold right now.
Reasons being:
1. I see inflation everywhere. I don't know how is it around your neighbourhood but prices are rising sharply around mine. Personally I think the economists underplay the inflation data. When necessities like food and oil are rising sharply, I think inflation is pretty bad.
2. I can't see the dollar picking up. Well, the Fed can improve the dollar position by raising interest rates but I don't think that the Fed will raise interest rates in the near future. In addition to weak dollar, I think the Fed is printing too much money.
3. Gold is a laggard among most commodities. Well we all know that commodities have an awesome bull run for someting like 7 years. Comparing metals with metals, by my own logical sense I compare gold with silver. After all, silver was used as a form of money back then with sterling pound. Maybe silver has a lot of industrial uses than gold but the divergence is quite large actually.
4. Well, most people say that oil has a nice correlation with gold. Oil up = higher inflation = looking for anti-inflation asset = gold up. I think this is the logic and in my opinion, I can't see oil coming down yet. So if oil is not coming down, gold has to go up.
 In the short term, there will be some deviations here and there but looking it from a long term perspective, they have a strong and positive relationship. I took this picture from this article actually. A good article actually if you have the time to read.
5. This is a gut feeling reason actually. I think gold is not shooting so much because the hype is about oil right now. The momentum is with oil and when oil consolidates for a period of time (I don't think it will correct so soon), money is going to go into gold.
Others
Earnings season kicks off again next week with GE on friday. De ja vu? Well, I am negative about the market so I can't be bothered with earnings actually. I have shorted what I need to short and will stay that way for a while.
Oh ya, about vietnam situation. Read this. Headline is "Vietnam Dong Investors Use Black Market for Dollars".
Performance to date
Before I begin...
"Chart traders have no reason not to continue buying, at this point. The crude oil chart presents a classic bullish picture with more to go." Quoted from this article by John Kilduff on cnbc.com.
"$150 crude oil seems a virtual certainty, but it may prove as fleeting as a snow cone on a hot summer day."
He also added another statement to cover both side of oil story. But the thing I want to point out is the phrase that he uses - a classic bullish picture. Well, you remember a post 6 weeks ago (I'm lazy to find it), he says that oil was showing a topping chart. In 6 weeks alone, a topping chart has turned into a CLASSIC BULLISH picture, how amazing is that? =)
John P. Kilduff Senior Vice President Of Energy at MF Global Ltd.
Gold and more Gold
I urge most of you out there to buy gold right now.
Reasons being:
1. I see inflation everywhere. I don't know how is it around your neighbourhood but prices are rising sharply around mine. Personally I think the economists underplay the inflation data. When necessities like food and oil are rising sharply, I think inflation is pretty bad.
2. I can't see the dollar picking up. Well, the Fed can improve the dollar position by raising interest rates but I don't think that the Fed will raise interest rates in the near future. In addition to weak dollar, I think the Fed is printing too much money.
3. Gold is a laggard among most commodities. Well we all know that commodities have an awesome bull run for someting like 7 years. Comparing metals with metals, by my own logical sense I compare gold with silver. After all, silver was used as a form of money back then with sterling pound. Maybe silver has a lot of industrial uses than gold but the divergence is quite large actually.

4. Well, most people say that oil has a nice correlation with gold. Oil up = higher inflation = looking for anti-inflation asset = gold up. I think this is the logic and in my opinion, I can't see oil coming down yet. So if oil is not coming down, gold has to go up.
 In the short term, there will be some deviations here and there but looking it from a long term perspective, they have a strong and positive relationship. I took this picture from this article actually. A good article actually if you have the time to read.
5. This is a gut feeling reason actually. I think gold is not shooting so much because the hype is about oil right now. The momentum is with oil and when oil consolidates for a period of time (I don't think it will correct so soon), money is going to go into gold.
Others
Earnings season kicks off again next week with GE on friday. De ja vu? Well, I am negative about the market so I can't be bothered with earnings actually. I have shorted what I need to short and will stay that way for a while.
Oh ya, about vietnam situation. Read this. Headline is "Vietnam Dong Investors Use Black Market for Dollars".
Performance to date
| Name | Price shorted ($) | Current price ($) | % Change |
| Lehman Bro | 24.15 | 22.85 | -5.38 |
| General Motors | 13.99 | 10.12 | -27.66 |
| AMR | 6.22 | 4.83 | -22.35 |
| Citigroup Inc | 19.40 | 16.82 | -13.30 |
| Fannie Mae | 21.51 | 18.78 | -12.69 |
| AIG | 27.82 | 26.24 | -5.68 |
| Capitaland | 5.85 | 5.79 | Pathetic |
| CityDev | 10.20 | 10.90 | OMG +6.86 |
| SGX | 7.16 | 6.68 | -6.71 |
| Commodities | Price bought ($) | Current price ($) | Profit/loss ($) |
| Gold | 884.80 | 935.70 | 50.90 |
| Oil | 135.15 | 144.13 | 8.98 |
Get inside information from the president and you will probably lose half your money. If you get it from the chairman of the board, you will lose all of your money.
Jim Rogers
Wednesday, July 2, 2008
Mid Week Pit Stop #11
Trade or Invest?
It is very important that I am only refering to stocks over here. Real estate, fixed deposit, bonds etc are all not included even though they are forms of investment as well. Commodities also belong to another category. Personally I love to invest in gold until it reaches $2000 right now.
I am definitely for trading rather than investing. Quite obvious isnt it (just read any post)? The no.1 reason why I support trading is because you are exposed to the short side of the market. Usually, the market moves up 1/3 of the time, down 1/3 of the time and sideways or flat for the last 1/3. By sticking to only buy-and-hold, you are only catching 1/3 of the market movement and you have to make sound decisions during this time period.
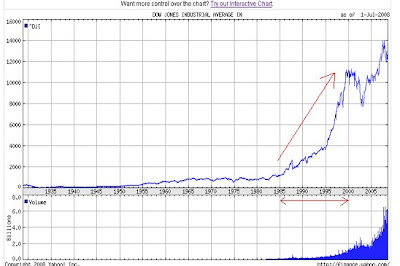
There is a super bull run from year 1982 to 2000. A bear market took place from 2000 to 2003 because of 9/11 attack and burst of dot-com bubble. This super bull run actually continues for another 4 years before it peaks out in October 2007. Anyone who invests in this period will tell you that buy-and-hold works. Well, this bull run produces a Warren Buffett. It works! I have to quote something from Buffett's letter to shareholders.
"During the 20th century, the Dow advanced from 66 to 11,497. This gain, though it appears huge, shrinks to 5.3% when compounded annually. An investor who owned the Dow throughout the century would also have received generous dividends for much of the period, but only about 2% or so in the final years. It was a wonderful century."
"Think now about this century. For investors to merely match that 5.3% market-value gain, the Dow--recently below 13,000--would need to close at about 2,000,000 on December 31, 2099. We are now eight years into this century, and we have racked up less than 2,000 of the 1,988,000 Dow points the market needed to travel in this hundred years to equal the 5.3% of the last."
2,000,000 Dow points!
Of course if you have wonderful foresight to spot certain good companies that can buck the overall trend of the market then I will throw in the white towel.
The thing is do you seriously expect the coming future to match the super bull run during the 1982-2000 period. What if after this bear market, the market moves into a lull period. How would you be doing as an investor before 1982?
Investing in emerging economies
China was a wonderful story for investors.
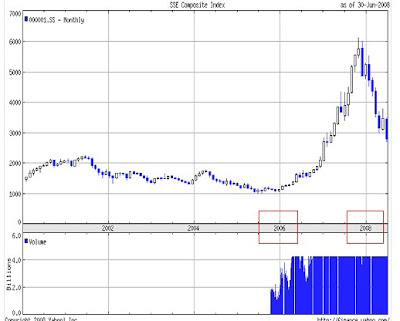
China was a crazy story. Almost everyone in china parks their money into the stock market. They even had a song for the stock market. The story was a quick one. In two years, it had gone up close to 500% and in approximately half a year, it was cut by half. Burst of a bubble? Why would you want to give up on the opportunity to short this market? Opportunity like this comes and goes all the time when people start to find new ideas or things to place their money in. Give yourself a chance to be in on the long side as well as the short side.
Subscribe to:
Posts (Atom)